Ironman Kona 2015 Results Analysis and Comparative Statistics

Ironman Kona 2015 Results Analysis: Overall,  Splits, by Division, Correlation, Annual Comparisons

By Raymond Britt

The 2015 Ironman Triathlon World Championship proved once again to be one of the most exciting, challenging, unpredictable and majestic in the world of endurance sports. This year lived up to these elements, with surprise first-time winners, a record number of starters and finishers, a higher than average finish time (overall and by age group).


Before and after my years of qualifying for and racing in Kona: 2002 to 2004) I've compiled comprehensive analysis on the path to qualifying for Ironman Kona, To provide this unique view, I've gone deep into annual race data to provide detailed and exclusive analysis for triathletes who want to understand the true dynamics of the event.

Our initial analysis of the somewhat more comparatively difficult 2015 race is below in thirteen charts. Here are just some the highlights:

  1. Starters: Most in Ironman History: 2,370, 12.3% over 2014, and most since at least 2002
  2. Finishers Most in Ironman History: 2,000+, 10.8% growth over 2014, most since at least 2002 
  3. DNF rate, 6.7 vs 6.0% in 2014, and only topped in years 2004 and 2009 since 2002
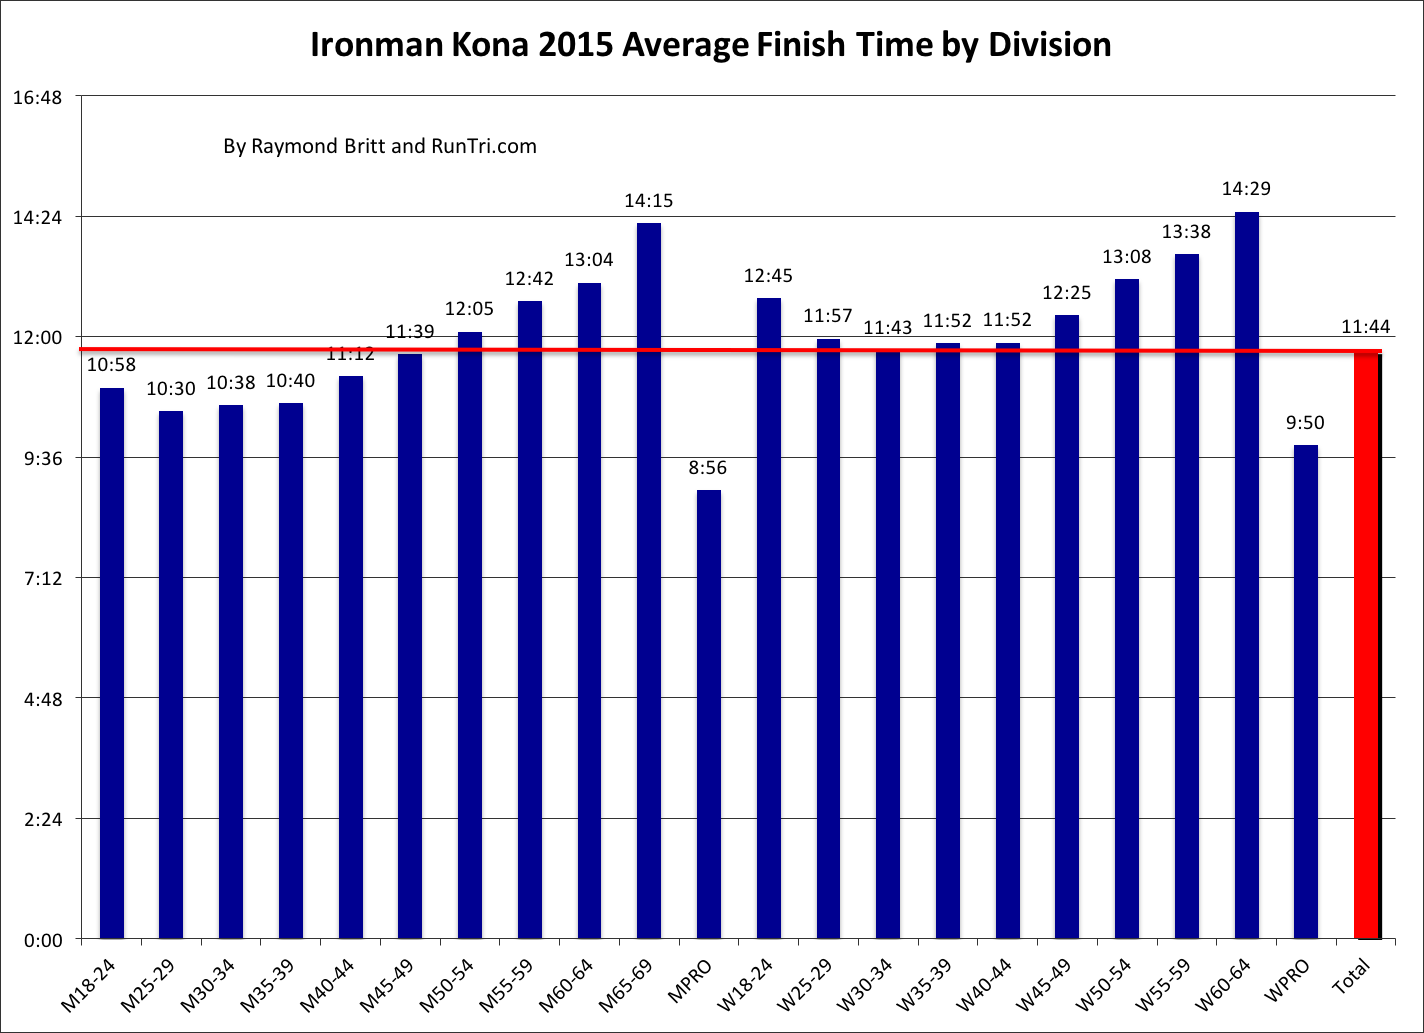
  4. Average Finish Time for all Finishers: 11:44, other than 2004 lowest going back to 2002
  5. Average Overall Splits: Swim 1:16 (11%), Bike 5:53 (50%), Run 4:23 (37%), Transitions 0:11
  6. Splits for each race division are shown, and by and large, reveal a similar pattern vs overall
  7. Comparing Splits 2009 to 2015: the 5:53 bike is about average, but the 4:23 run is worst
  8. Finish Times by Division 2014 vs 2015: notably slower in typically stronger divisions 30s-40s
  9. Total Finishers, Growth 2013 to 2015: new trend vs a many years of limits around 1800
  10. DNF Rates for each Division 2014 vs 2014
  11. Correlation Between Bike snd Run Splits for each athlete plotted on a single chart that illustrates the tendency of more athletes cycling too fast, followed by slower runs
  12. Division Comparisons (2 pages): Average Finish Times by age group 2009 to 2015
  13. Everything Else For all of our comprehensive Kona posts of past years, see www.RaceKona.com


Concert Review: Boston's Exceptional Greatest Hits on 40th Anniversary Tour in Chicago

By Raymond Britt, Published by Chicago Tribune


This year represents Boston's 40th Anniversary Tour, but the band sounded much younger, fresher, with tighter musicianship, and ultimately, the most impressive performance of the five times I've seen them live more impressive than ever.

Memorial Day approaching, the concert fittingly began with Tom Scholz, the band's founder and creative genius, playing The Star Spangled Banner in front of a huge American Flag.


The concert featured Boston's greatest hits, including Rock and Roll Band, More than a Feeling, Don't Look Back, Amanda, Cool The Engines, and others the audience seemed to know by heart. New to the show was the sing 'Higher Power' taken from the Boston Greatest Hits album.


The Touring Band, the same personnel as last year's Chicago concert, had significantly inproved, preforming as a tight unit, with effortless and more confidence.

  • 1. Tom Scholz, on guitar, keyboards, inventions, patents; genius and almost everything musical
  • 2. Gary Pihl, guitar, grew up in Chicago, for decades has done just about everything else as Tom's musical and business partner; 
  • 3. Tommy Decarlo on vocals, showed new talent interacting with the enthusiastic audience;
  • 4. Tracie Ferrie on bass the last three tours, really enjoyed himself, spinning in circles on one song, flat on his back during another; 
  • 5. Beth Cohen, on her second Boston tour, is a fiery addition on keyboards, lead guitar and vocals, nailed her parts every time.
  • 6. Curly Smith, a veteran Boston tour drummer, played this show, and alternated with Jeff Neal


The short recap and forecast: Boston sounded better than ever in this 2016 Chicago 40th anniversary tour, and I project the band is going to be thrilling audiences for many more years to come.

Copyright © 2016, Chicago Tribune

Boston Marathon 2014 Results and Analysis by Age Group, Compared to Previous Years, and More

Excerpts Featured by Competitor.com
Boston Marathon 2014, rebounding from the tragedy of 2013,  proved to be a spectacular success,
setting or nearly matching many historical records.
RunTri.com's Comprehensive Boston Marathon 2014 Results coverage dives into the race results, going into detail by age group mix, finishers by age group, average finish times by age group, all presented below.


Extra Credit: For comparison, similar analysis of 2012 and 2011 Boston Marathons are presented near the end of this post. For everything else -- nearly 50 posts of our Boston Marathon Analysis -- See our Racing Boston page and Stats/Results/Analysis pages.


 More to come . . .


-------------------------------------------------------------------------------------------------------------------------------

Boston 2012 Runner Stats: Average Finish Time, Runners, Finishers, DNS, DNF, Deferred to 2013
Results Analysis


How challenging was the 2012 Boston Marathon?  The heat crushed expectations and finish times, making 2012 the toughest Boston since 2004. Make that tougher -- the average time in 2012 was 5 minutes slower than in 2004:

  • Average Finish Time: 4:18:27
  • 2012 vs 2010: 28 minutes slower, or 10%, slower compared to 2010's 3:50 (we felt 2011's results were too wind-aided)
  • 2012 vs 2004: 5 minutes, or 2%, slower: 4:18 vs 4:13
We've crunched the numbers to compare Boston 2012 against both Boston 2004 and a more representative Boston 2010 by race division, by gender and age, and more, including average results for each of the 5000+ global cities represented on race day

How well did you do vs your division, other runners your age, vs 2004 and 2010? The answers are below.


Boston Marathon 2012 Race Summary:

  • Elite Men: Wesley Korir comes from behind  and takes the win 2:12:41
  • Elite Women: Sharon Cherop wins in 2:31:50, 2 seconds ahead of Jemima Sumgong
  • Men's Wheelchair: Joshua Cassidy wins new course record 1:18:25 by 2 seconds
  • Women's Wheelchair: Shirley Reilly wins 1:37:36 unofficial, photo finish
  • Conditions: a reported 80+ degrees in Newton, 'relentless sun' no wind


    Boston Marathon 2009 Race Start by Raymond Britt
    Shortly after the race, we'll be developing a summary of race results, such as those from 2011 below; we'll be posting the 2012 version as soon as data comes available.

    Boston Marathon 2011 Results Analysis

    In the record-setting 2011 Boston Marathon, 23,879 finished the legendary 26.2 mile course in an average time of 3:54:31.


    See our complete analysis of average finish time by gender and age.


    How many Boston finishers run qualifying times on the course itself? Here's the analysis of 2010 race results:

    More than 9,400 runners (41% of total) in the 2010 Boston Marathon ran times that will qualify them for the 2011 race. Leading the way, nearly half the F40-44 age group ran qualifying times. Impressive numbers, to be sure. Certainly higher than any other large US race. 

    However, consider the fact that 100% of runners (except 2000+ running for charity) ran a qualifying time to get into the race. One might reasonably expect a much higher number of re-qualifying times. That less than half were able to run as fast as their original qualifying time speaks to the difficulty of the Boston course. We know from experience: Boston is tough.  To learn more.