Ironman 70.3 2015 Rio Results Analysis

Ironman has added several new 70.3 events since our most recent detailed and comparative analysis of half Ironman Rankings.

We'll be catching up as time permits, here's a summary of 2015's Ironman Rio 70.3. At a 5:56 average finish time, it's slightly faster than average, the number of finishers, at 797, is on the low end.

Here's our Analysis of the Rio 70.3 event in 2015.


Best Rio Olympics Coverage: Wall Street Journal (featuring our Analytics)

By Raymond Britt
Add caption

The Wall Street Journal's Pulitzer Prize winning Kevin Helliker has written an excellent article, entitled 'At the Rio Olympics, Women Athletes Bump Against a Gold Ceiling'.

While putting the comprehensive article together, as he and others at WSJ reached out to me with a request to conduct analysis that confirmed the ultimate headline.

Seeing that many events in the Rio Olympics appeared to clearly differ by gender, such as womens' notably shorter cycling road course.

In present day endurance events in which both genders complete the same distance, Kevin wondered, do percent of women finish relatively close to men with higher rates/fewer DNFs.


We dove deep into our archives, and analyzed results by gender and division for Boston Marathon (1996-2016) and Ironman Triathlon World Championship (2000 to 2015).

Our striking conclusion: Women have hammered their way to match male finisher rates.

Women endurance athletes have battled year by year to prove mens' equal as measured by finisher rates with the gap sharply narrowing obviously on the historical and trending analysis.

Indeed, there is no reason for differences in event length or course type.

Here's an overview of our analytics findings the Journal relied on:

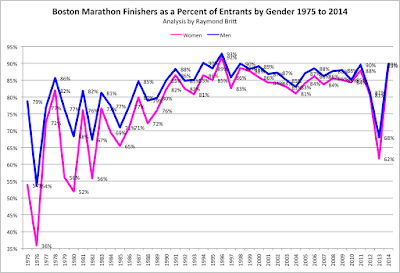
1. Big Picture 40 Year Evolution of Boston Marathon Finisher rates
-- 1970s: men 20% more likely to finish
-- 1980s: gap closing but still wide, 10% area
-- 2000s: gap slowly disappears

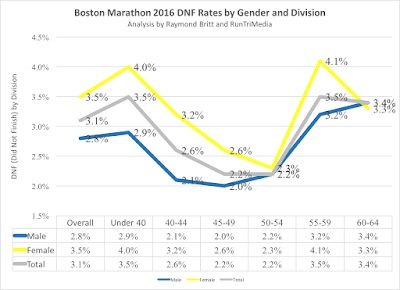
2. Boston Marathon 2016 DNF Rates (see chart, including rates by Division)


-- overall: 3.1%
-- Women 3.5%
-- Men: 2.8%
-- and by division, under 1% most often


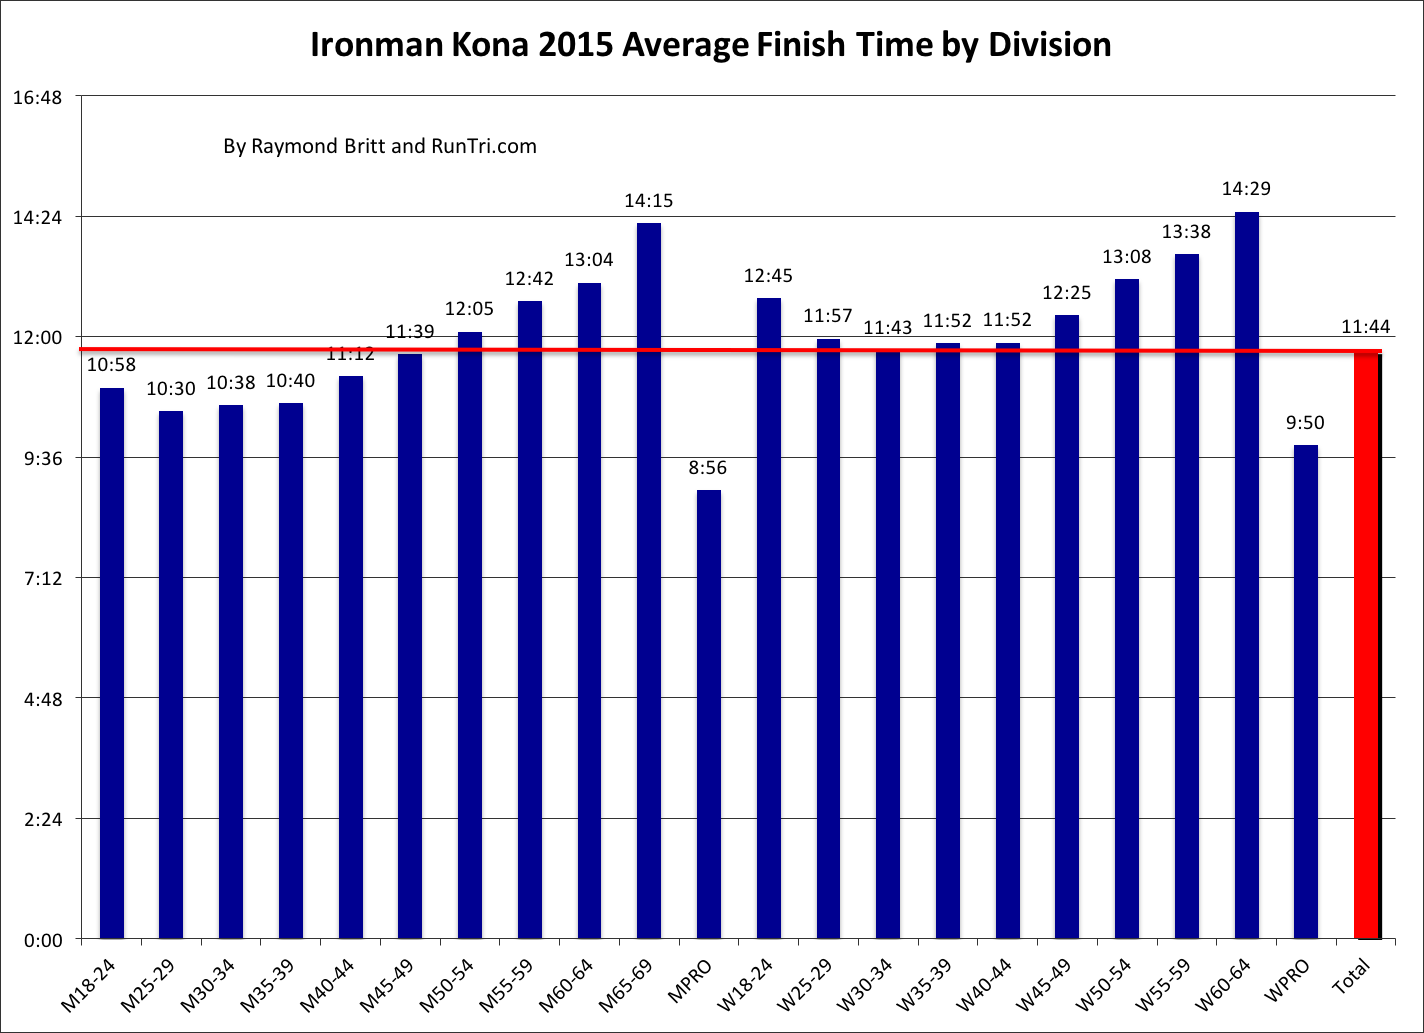
3.  Ironman Kona (see 3 charts: DNF Bike, DNF Run, Overall DNF)
-- Overall: 6.7%
-- Women: 6.0% excluding Women Pros
-- Men: 6.2% excluding men pros

For more details, see our comprehensive analyses of
-- Boston Marathon
-- Ironman Kona
-- 500+ analytic/stats Articles, posts, for more than 100


Ironman Kona 2015 Results Analysis and Comparative Statistics

Ironman Kona 2015 Results Analysis: Overall,  Splits, by Division, Correlation, Annual Comparisons

By Raymond Britt

The 2015 Ironman Triathlon World Championship proved once again to be one of the most exciting, challenging, unpredictable and majestic in the world of endurance sports. This year lived up to these elements, with surprise first-time winners, a record number of starters and finishers, a higher than average finish time (overall and by age group).


Before and after my years of qualifying for and racing in Kona: 2002 to 2004) I've compiled comprehensive analysis on the path to qualifying for Ironman Kona, To provide this unique view, I've gone deep into annual race data to provide detailed and exclusive analysis for triathletes who want to understand the true dynamics of the event.

Our initial analysis of the somewhat more comparatively difficult 2015 race is below in thirteen charts. Here are just some the highlights:

  1. Starters: Most in Ironman History: 2,370, 12.3% over 2014, and most since at least 2002
  2. Finishers Most in Ironman History: 2,000+, 10.8% growth over 2014, most since at least 2002 
  3. DNF rate, 6.7 vs 6.0% in 2014, and only topped in years 2004 and 2009 since 2002
  4. Average Finish Time for all Finishers: 11:44, other than 2004 lowest going back to 2002
  5. Average Overall Splits: Swim 1:16 (11%), Bike 5:53 (50%), Run 4:23 (37%), Transitions 0:11
  6. Splits for each race division are shown, and by and large, reveal a similar pattern vs overall
  7. Comparing Splits 2009 to 2015: the 5:53 bike is about average, but the 4:23 run is worst
  8. Finish Times by Division 2014 vs 2015: notably slower in typically stronger divisions 30s-40s
  9. Total Finishers, Growth 2013 to 2015: new trend vs a many years of limits around 1800
  10. DNF Rates for each Division 2014 vs 2014
  11. Correlation Between Bike snd Run Splits for each athlete plotted on a single chart that illustrates the tendency of more athletes cycling too fast, followed by slower runs
  12. Division Comparisons (2 pages): Average Finish Times by age group 2009 to 2015
  13. Everything Else For all of our comprehensive Kona posts of past years, see www.RaceKona.com