 New York City Marathon Results Links and Historical Analysis
TCS NYC Marathon 2017 Results Links
| Place | Bib | Name | Time | State | Country | Citizenship |
| 1 | 5 | Geoffrey Kamworor | 2:10:53 | Kenya | KEN | |
| 2 | 4 | Wilson Kipsang | 2:10:56 | Kenya | KEN | |
| 3 | 7 | Lelisa Desisa | 2:11:32 | Ethiopia | ETH | |
| 4 | 6 | Lemi Berhanu | 2:11:52 | Ethiopia | ETH | |
| 5 | 10 | Tadesse Abraham | 2:12:01 | Switzerland | SUI | |
| 6 | 14 | Michel Butter | 2:12:39 | Netherlands | NED | |
| 7 | 3 | Abdi Abdirahman | 2:12:48 | AZ | United States | USA |
| 8 | 16 | Koen Naert | 2:13:21 | Belgium | BEL | |
| 9 | 442 | Fikadu Girma Teferi | 2:13:58 | NY | United States | ETH |
| 10 | 12 | Shadrack Biwott | 2:14:57 | CA | United States | USA |
| Place | Bib | Name | Time | State | Country | Citizenship |
| 1 | 108 | Shalane Flanagan | 2:26:53 | OR | United States | USA |
| 2 | 101 | Mary Keitany | 2:27:54 | Kenya | KEN | |
| 3 | 105 | Mamitu Daska | 2:28:08 | NM | United States | ETH |
| 4 | 102 | Edna Kiplagat | 2:29:36 | Kenya | KEN | |
| 5 | 126 | Allie Kieffer | 2:29:39 | NY | United States | USA |
| 6 | 120 | Sara Dossena | 2:29:39 | Italy | ITA | |
| 7 | 117 | Eva Vrabcova | 2:29:41 | Czech Republic | CZE | |
| 8 | 114 | Kellyn Taylor | 2:29:56 | AZ | United States | USA |
| 9 | 106 | Diane Nukuri | 2:31:21 | AZ | United States | BDI |
| 10 | 116 | Stephanie Bruce | 2:31:44 | AZ | United States | USA |
| 11 | 109 | Buzunesh Deba | 2:32:01 | NY | United States | ETH |
RunTri New York City Marathon Historical Results Analysis
- New York City Marathon Comprehensive Results Analysis
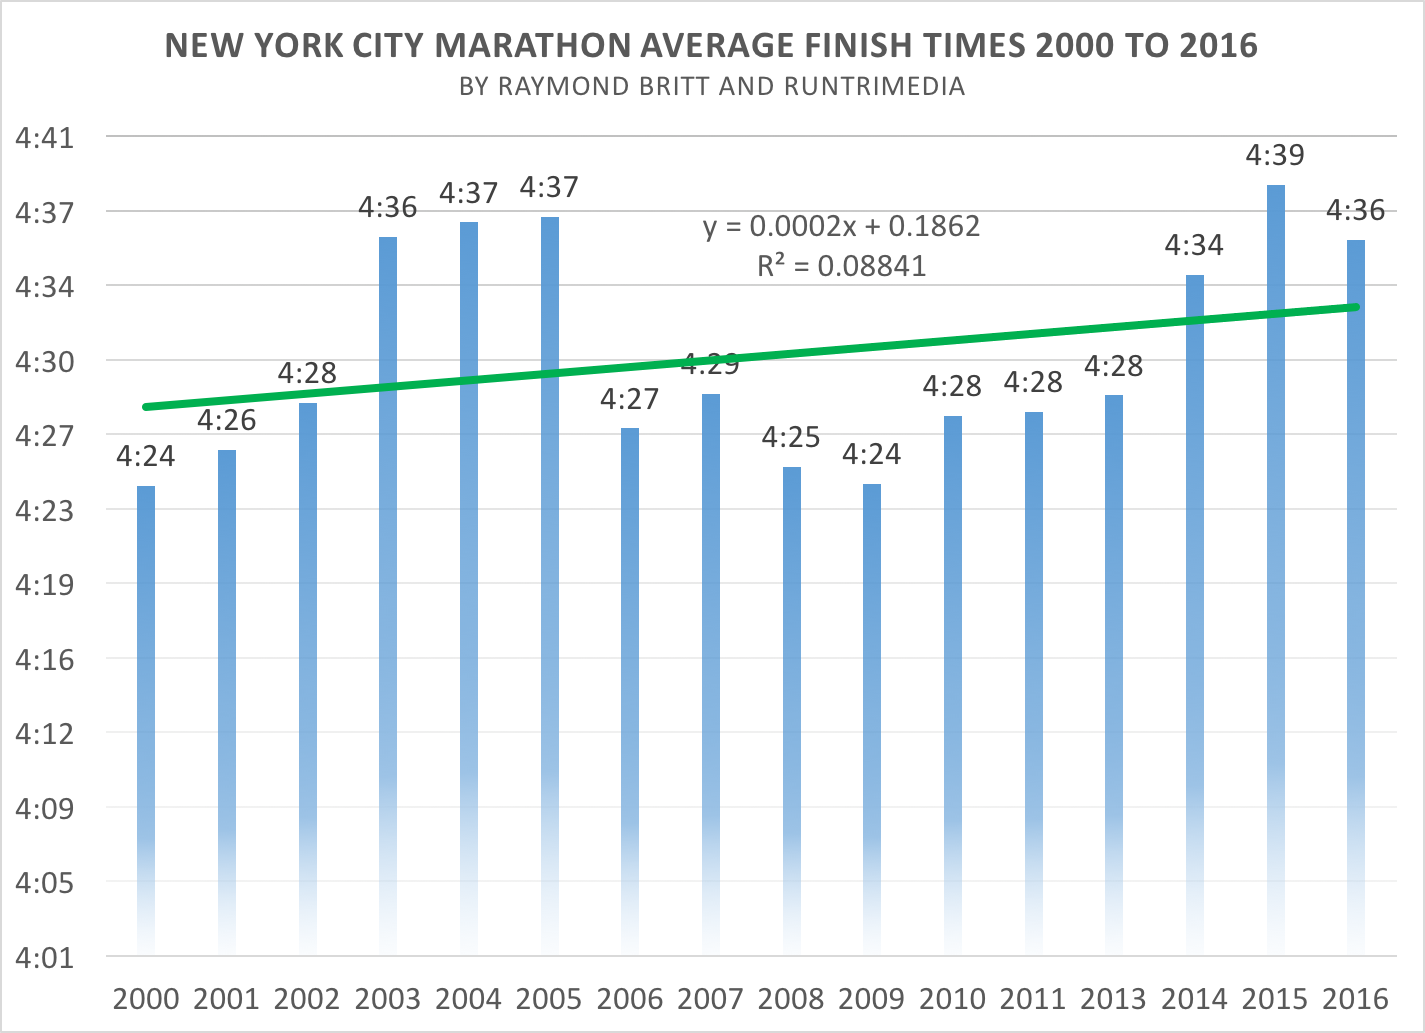
- Average Finish Times 2000 to 2011
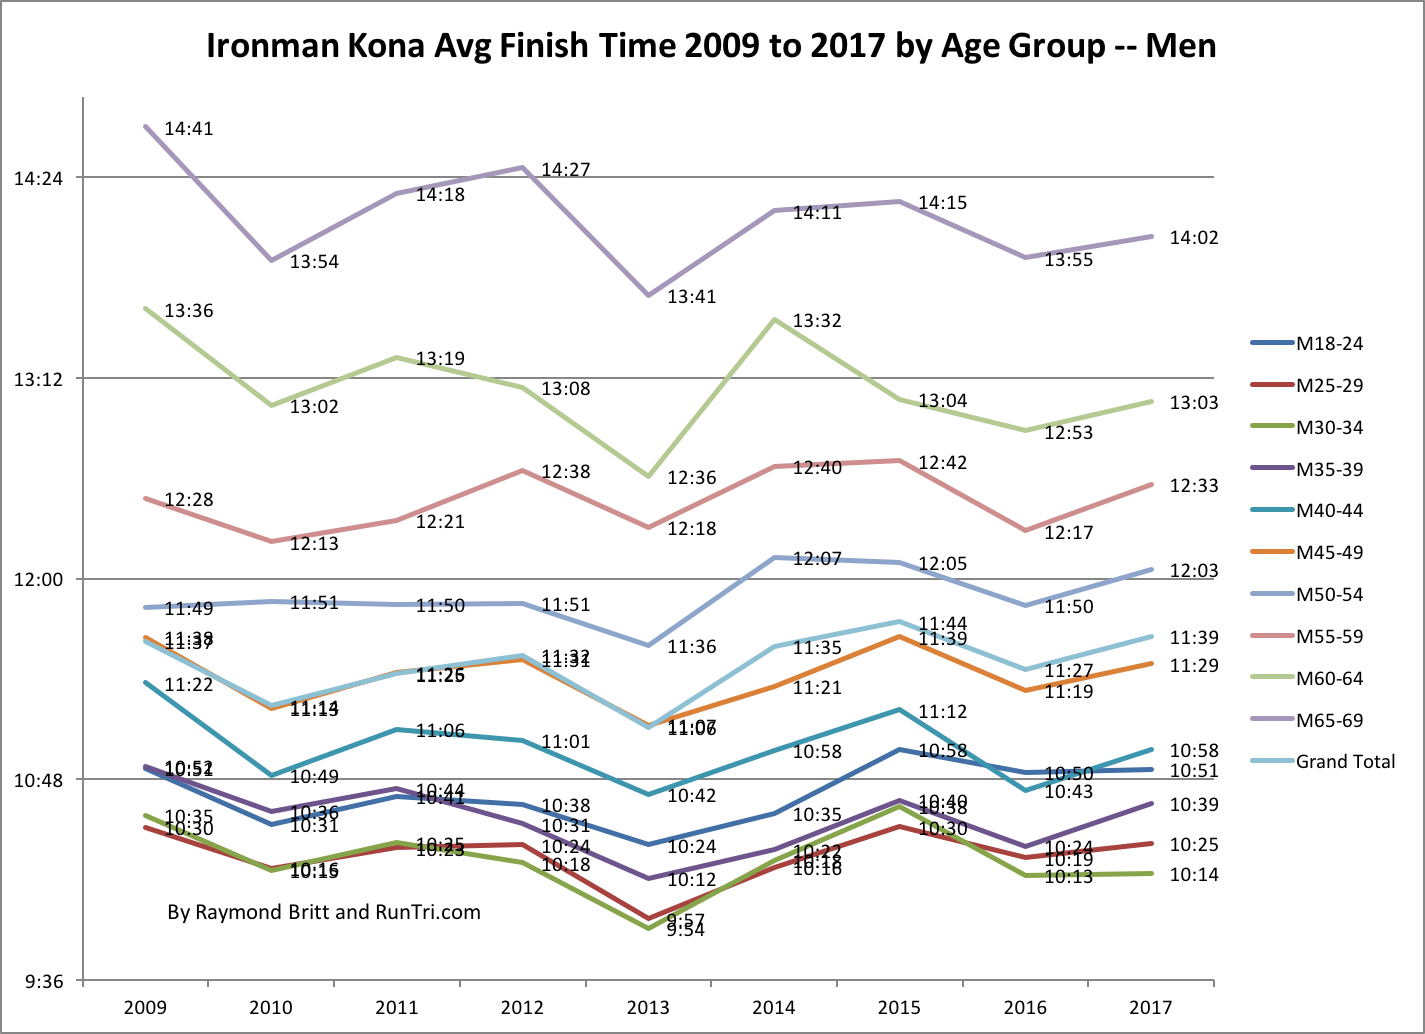
- Average Finish Times by Age Group
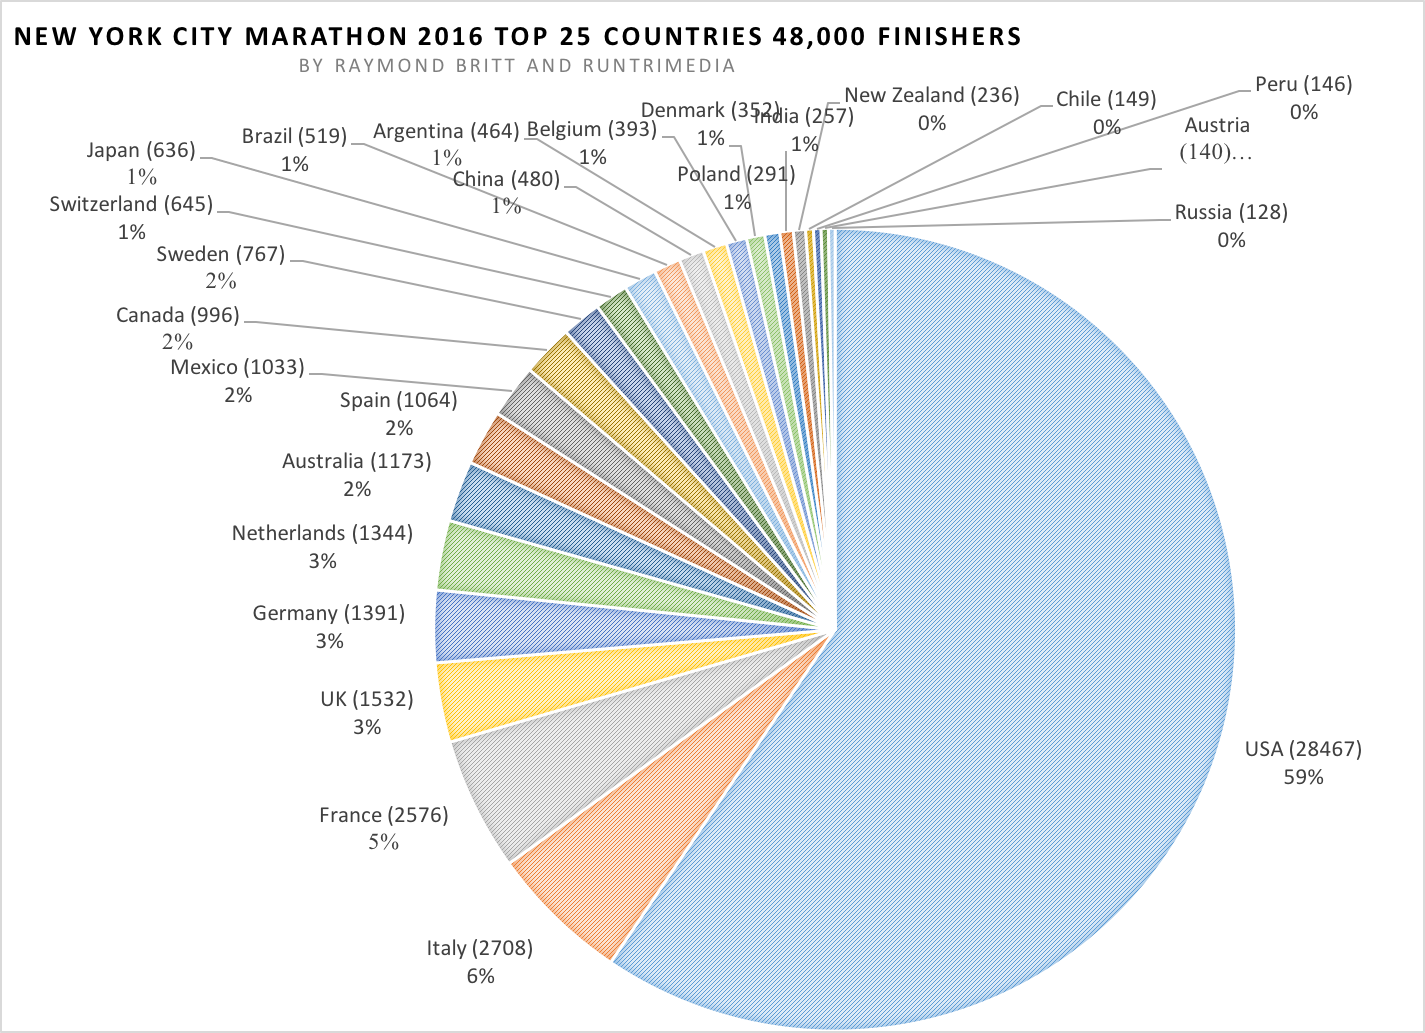
- Geographic Rankings: Fastest Countries and Cities by Age Group
- Geographic Results: Finish Times by Age Group by State or Country
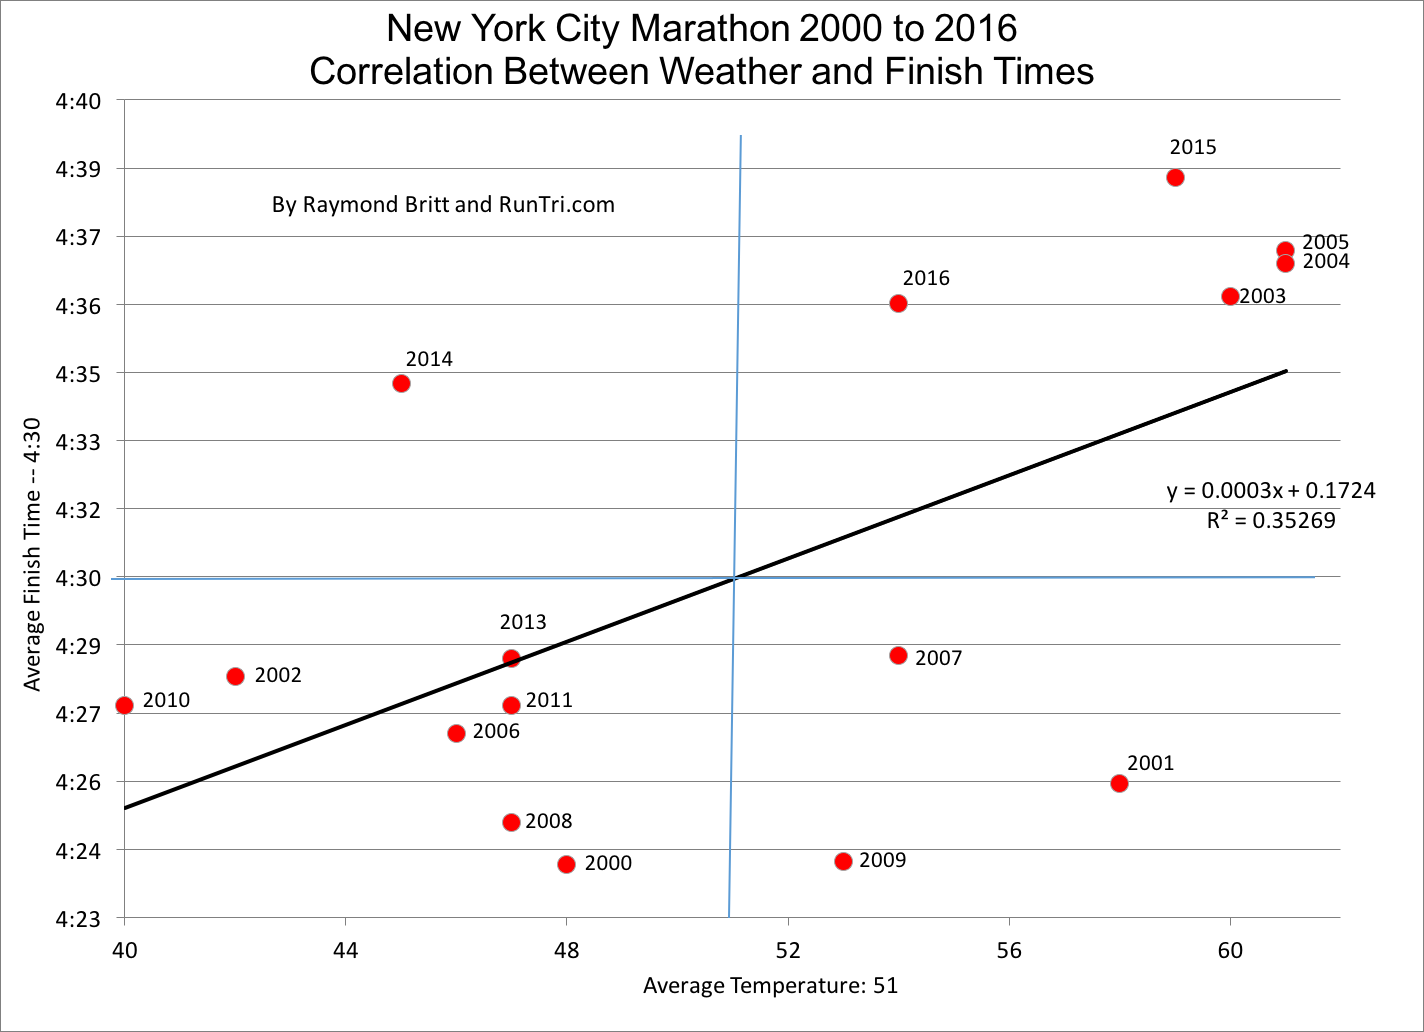
- Impact of Weather Conditions on Finish Times 2000 to 2016