By
Raymond Britt -- There is no such thing as an Easy Ironman. Covering 140.6 miles on any course, any day, in any variety of conditions, is a monumental challenge. Everyone who crosses the finish line knows how hard an Ironman triathlon is. But we were curious . . .
The RunTri Challenge Index. We had long been interested in a quantitative comparison, but found none, so we created the list -- the RunTri Challenge Index. RunTri analyzed results of more than 150,000 finishers (each year sees about
65,000 finishers) competing in 30 Ironman distance triathlons (including
Lake Tahoe,
Sweden, and
Mont-Tremblant, which still need to be added) to answer the question: which Ironman triathlon is hardest? Easiest? We've completed this analysis twice, and both are presented here.
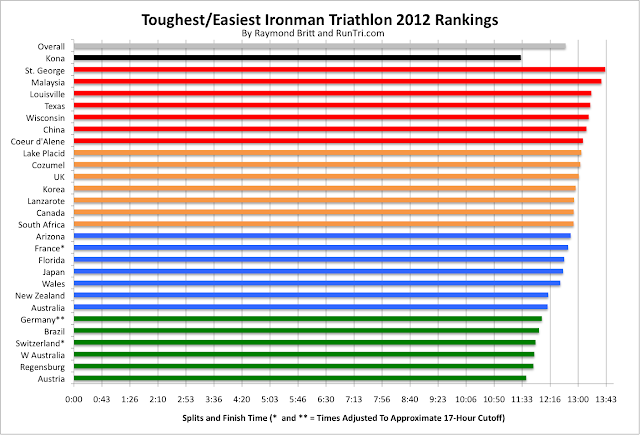
RunTri's Toughest/Easiest Ironman Races: Edition
Our rankings, portions of which have been published in Triathlete Magazine issues, have taken our original analysis into a deeper, more comprehensive direction, ranking races by discipline -- swim, bike or run -- to help athletes more accurately assess which races are easiest or toughest, depending on which elements of their triathlon skills are best or weakest. (we know you'll have many questions; see FAQs further down in this post)

RunTri's Original Top 25 Toughest/Easiest Ironman Races
Next, our original analysis, the Top 25 Toughest/Easiest Ironman Races and related analysis. Our original analytics in response to key questions about comparing the races still hold true for the new rankings.
We expect there will be much discussion about this list, and we are pleased to start the conversation. Is it perfect? No, and it doesn't pretend to be. But we've gone to great lengths to verify and validate as much as possible.
We've finished 29 Ironman triathlons (as documented in the book
Qualifying for Kona: The Road to the Ironman World Championship), including nearly half the races in this analysis, some multiple times, and are more than familiar with the difficulty of many others. In addition, we've also conducted
in-depth results analysis for most ranked races. The ranking is more than numbers, as we have taken care to test available qualitative factors where possible.
Frequently Asked Questions
Discussions and threads on chat boards from iamtri.com to beginnertriathlete.com, slowtwitch.com, to Facebook, Twitter and LinkedIn have been animated and active for quite some time. Each contains thoughtful observations and questions, including the following:
See notes below to understand how the list was generated, how we reconciled some non-quantitative factors, and discussion of some suggested alternative approaches.
To start, dive into our results analysis by race or more detail behind our Toughest/Easiest Ironman Triathlon Rankings.
|
North America
Ironman Kona World Championship
Extra Credit
| |
|
|
|
How many athletes were analyzed? The initial data were compiled for one or more years for each race, involving more than 50,000 athletes across races. This number included 41,000+ finishers, plus several thousand who raced in half ironman 70.3 events that offered slots. As of 2012, new races have been added and more than 65,000 athletes are registered to compete in 30 Ironman events.
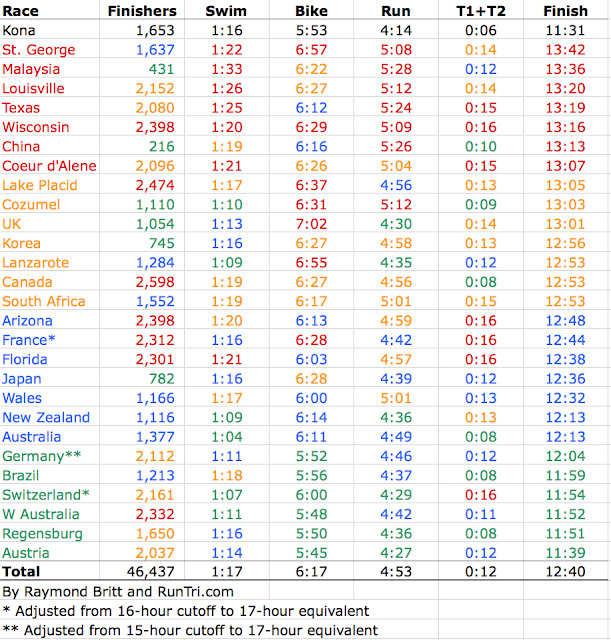
Data. We cut and pivot-tabled the data several ways, modes, medians, standard deviations, etc., and the results are similar enough that we are using average finish times. The data are updated as needed (e.g.,
Louisville), if new results change the ranking, and are based on new race data availability. For example, the
Inaugural Ironman Texas earned a spot among the toughest overall at 13:17. We'll be revising the rankings to reflect recent results, shortly.
For further details and links to data for each race, see
Detailed Comparisons between races.
For similar comparative charts, see our Toughest/Easiest
Swim,
Bike,
Run analyses.
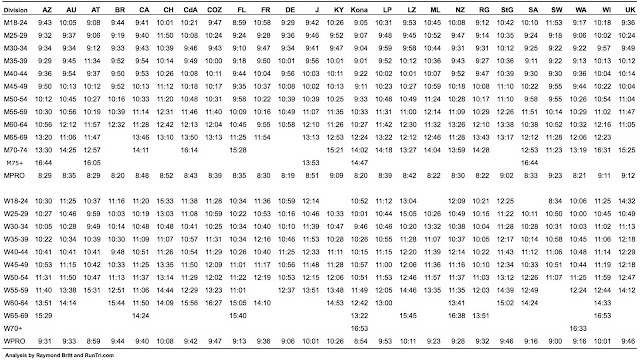
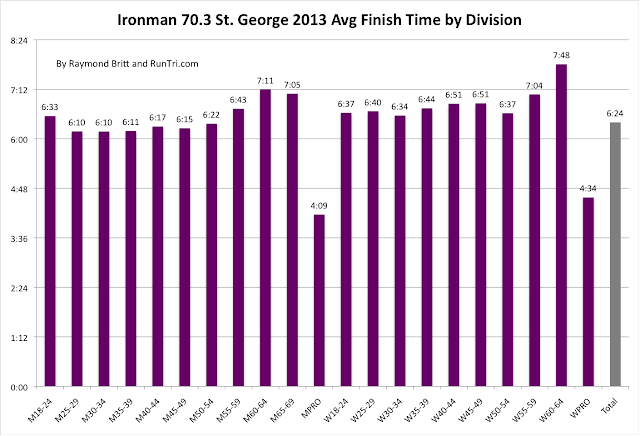
Wondering if the list differs by Age Group? See our
AG Analysis table, below.
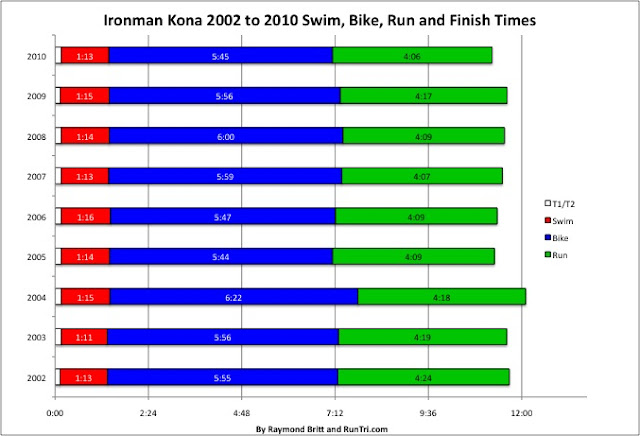
Kona: For most triathletes, Kona would rank in the top 5, if not toughest overall. World-class
Kona qualifiers are, of course, very skilled, and their average finish times are deceptively fast: average finish time is 11:37. This time would rank Kona among the 'easiest' Ironman events, and it's misleading in that respect. We've put Kona at the top of the chart, without finish time data to account for Kona's universally acknowledged difficulty.
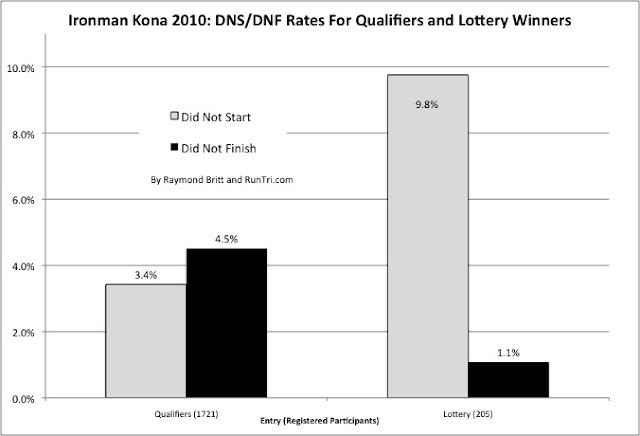
Kona Qualifiers vs Lottery Winners: DNS and DNF. Another look at DNFs: Kona lottery slot winners had a much lower DNF rate than Kona qualifiers, on the Kona course itself. Does that mean lottery winners are better triathletes than qualifiers? Certainly not. But those who did show up -- after a 9% DNS rate -- did apparently fight harder to cross the finish line.
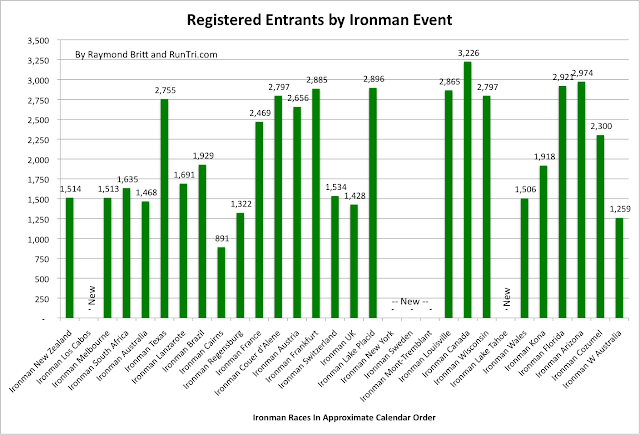
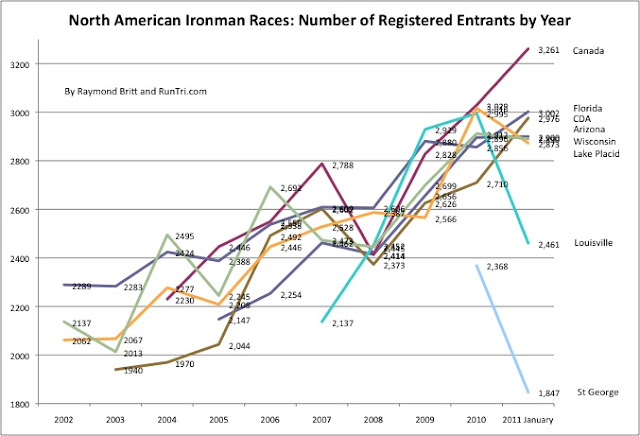
More Athletes per Race = Weaker Triathletes? Most Ironman races reach 'Sold Out' status quickly, though the maximum number of athletes per race differs. Not only that, but the cap on many races increases annually, especially in
North America where several races feature close to 3000 entrants.
Do races that allow upwards of 3,000 entrants end up having a weaker field overall, resulting in a tougher rating? It could be the case, except by the time race day arrives,
as many as 500 entrants choose not to race. Those that show up, for the most part, have trained hard and are prepared to race. And generally, lower DNF rates confirm the point (except, as noted often, when extraordinary conditions present)
Weather. Course conditions do vary from year to year, but overall results tend to be less impacted than you may expect. Personal experiences on races courses more than 5 times, through sun, heat, humidity, wind, rain, hail, fog and almost snow, bear this out.
However, in the cases where conditions do, in fact, lead to drastically different times in a race from one year to the next, e.g.,
Wisconsin (weather-affected DNF rates; chart below) and
Louisville 2009 vs. 2010, we make adjustments depending on data availability.
Speedsters -- Average vs Top x%. For those who might believe a top 100 or top 10% per age group might sway the analysis, the answer is generally no, it won't. Our analysis of 17 races -- Top 100 results vs All Finishers -- still ranks St. George, Louisville and UK among the toughest, Lanzarote and Lake Placid next tier, and Austria, Regensburg and Western Australia still are among the fastest. Others like Wisconsin, Cozumel, Canada and France vary somewhat, and we've factored that in to the overall results.
For another way to test this hypothesis, see our
Kona Qualifying Times by race and age group.
Europe. Others might say faster times in Europe indicate better athletes. I'd say there is a small degree of truth, based on personal experience racing in
Austria,
Germany and
Switzerland. But the difference is less than you would think; see above 'Speedsters' analysis.
Further, the courses in Europe have been modified to reduce some of the challenge. Switzerland in particular; those of us who raced there a decade ago faced a daunting, steep, technical 3-loop course. That's long gone now.
The Austria time strikes us as too good to be true, so did the 5:46 average bike split, for example (and it's
even faster in 2011). Same is true on some other courses. Here's the evidence: bike splits examples across the board.
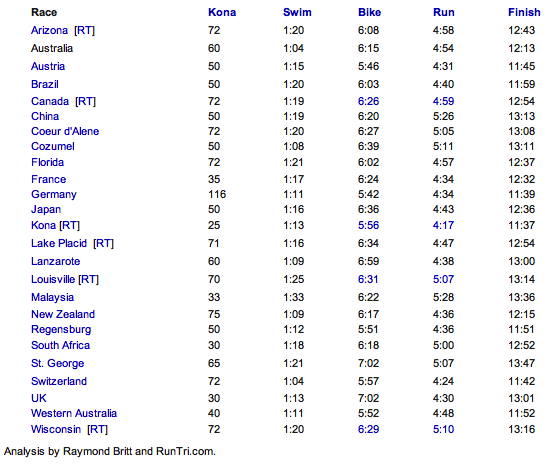
And we've looked at the 'better athlete' question a different way, comparing Kona qualifiers from 13 top countries, competing head-to-head by age group at Kona 2010. the results are inconclusive overall;
country dominance varies by age group, as illustrated in the chart below. For more, see
Which Countries Have the Fastest Triathletes?
What about Challenge Roth? Performance there raises skepticism about course measurement; we've raced Roth, we agree. So it's not included.
Lanzarote. Yes, the bike course at
Ironman Lanzarote is a monster, with a roughly 7-hour average time. Yes, your friend says Lanzarote is as tough as Kona, and on the bike course, that's probably true. But, surprisingly, the average marathon times in Lanzarote are quite fast, in the mid 4-hour range.
Combined, Lanzarote's average finish time is a brisk 12:30 or so. It's been that way for the last 2 years. One factor behind these fast times is self-selection; a younger group of triathletes race Lanzarote. Taking that into consideration, we rank Lanzarote at the 13-hour level, a more likely time if the field's demographic was consistent with most other races.
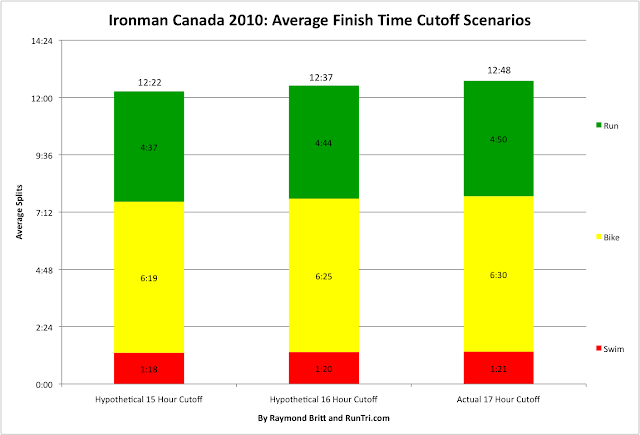
Cut-off Time Adjustments. Some European races have shorter overall cutoff times. France and Switzerland ends in 16 hours, not 17. Germany ends in 15 hours. We've done the
analysis to adjust for the difference using Ironman Canada results and calculating average 15 and 16 hour cutoff times. The answer: add 26 minutes to Germany's time, and 11 minutes to Switzerland's time to make all three comparable to all other 17 hour cutoff races.
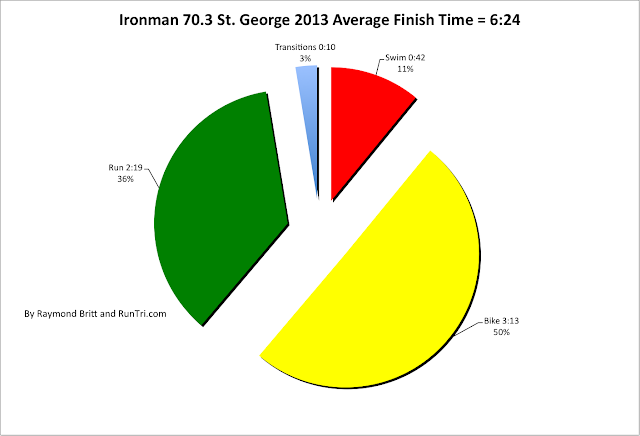
The 50% Rule. Another benchmark we look at is what we call
The 50% Rule. In race after race, the bike split is approximately 50% of overall time.
Even for races with 15 or 16 hour cutoff times, this test holds true. If the bike split was 60% in these races, reflecting faster marathons to beat the cutoff, we'd be more concerned.
Flat Bike Courses = Easier? Many assume: Ironman Florida and Arizona should be considered 'easy' because the bike course is so flat. Flat does not always = faster. Ask any pro who expected a PR bike split on either course, and left disappointed: flat is deceptively hard. Note: no Ironman bike split record has been set on either course; not even close.
Same muscles used 112 miles, no variation, it takes a surprising toll. Race Florida and you'll actually wish for hills and descents, anything for the chance to use different leg muscles. In
Arizona, expect brisk desert winds to hinder your progress; see how speeds drop sharply by
lap 3 on the bike course.
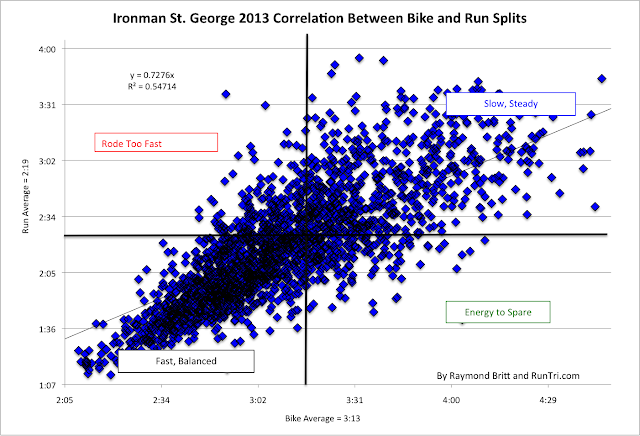
Correlation between Bike and Run Splits. We've cut the data to show the correlation between bike and run splits for several races, including
Kona,
Wisconsin,
Canada,
Louisville and others. Click on the bike or run split link for the respective races above. Below, the
Ironman Wisconsin 2010 chart.
Other Toughest Lists. For perspective, we've done similar analysis for
top 25 marathons and
35 half ironman 70.3 races. Take a look.
So. Reading the data literally Ironman Switzerland and Ironman Austria appear to have the fastest average time, while
Ironman St. George is clearly the hardest, followed by Ironman Malaysia and Ironman Wisconsin. But you have to dig deeper, into the race splits, to see what makes these races stand out. See links above.
Finale. After all the
charts, tables, debates, and comments, one thing remains definitive: there is no such thing as an easy Ironman triathlon. Swim 2.4 miles, ride 112 miles, run a marathon, and you've done what you once -- be honest -- considered impossible.
All of us, at one time or another, felt the same way. But we committed, we trained, we started and we finished the toughest triathlon there is: an Ironman triathlon.
No matter where in the world you race, getting to the Ironman finish line is special. We've shared the experience, we've conquered it. Nothing was easy, it was often tougher than expected, and without question, it was worth it to be a proud member of an triathlon's most exclusive club: Ironman finisher.
Feel free t
o Contact us with questions or comments.
--
Raymond Britt, 29-time Ironman finisher.


.png)