Showing posts sorted by date for query St. George. Sort by relevance Show all posts

Ironman 70.3 St. George 2013 Results Analysis

For the latest, see 

Ironman 70.3 St. George 2014 Results Analysis

---------------------------------------------------------------------------------
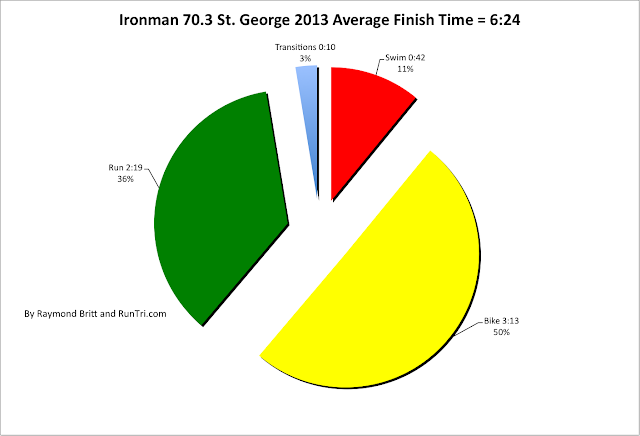
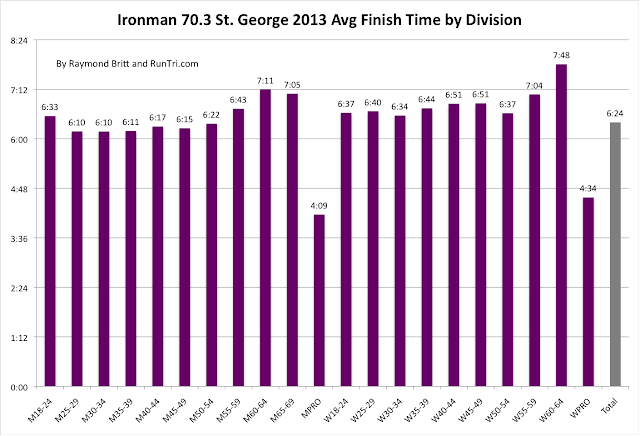
Ironman 70.3 St. George, a beautiful but tough long-distance triathlon, took place under almost perfect conditions, resulting in an average finish time of 6:24 (we were close; we had projected 6:30, see below). At 6:24, it's one of the toughest Ironman 70.3 courses we've analyzed, and much slower than the average 6:00 finish time for all events.

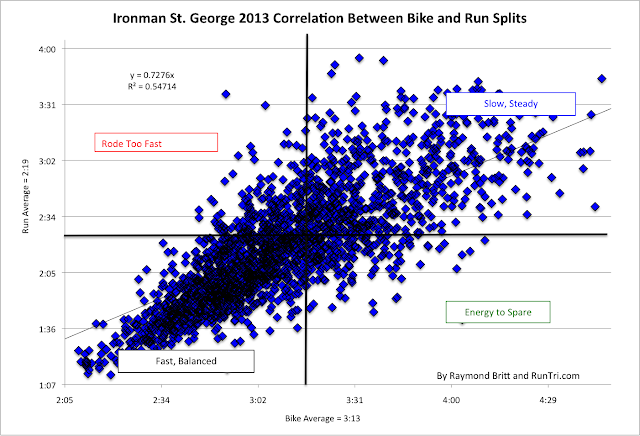
The splits times as a percent of total were almost exactly what our models predict: 50% of time on the bike. Also note our correlation between bike and run splits for all finishers; results are significantly more bunched together, and with a higher R^2 than in 2012. Far more remarkable was the difference in DNF rates and finishers:
  • Ironman 140.6 St. George 2012: 29% DNF; 1,022 finishers
  • Ironman 70.3 St. George 2013: 4% DNF; 2,105 finishers
Ironman 70.3 St. George 2013 Results Analysis


Pre-Race Ironman 70.3 Results Analysis Projections

In recent years, the full 140.6 mile Ironman St. George event had been one of the toughest courses on the Ironman circuit. For 2013, the race is now an Ironman 70.3 distance, and it's now the US. Pro Championship race.

The change brought up an interesting question: with Ironman St. George now a 70.3 mile event, effectively half the old race, what finish times could be expected?

We projected an overall finish time of 6:30 (see below), and we were within 1% or so: the actual result was 6:24 (see above).

In the past, we've presents results analysis of Ironman St. George 2010, 2011 and 2012, and we've also conducted in-depth analysis of 15 pairings of similar Ironman 140.6 and Ironman 70.3 events to predict average finish time at one distance based on actual results at another. Combining these analytics, here are the results.

Projections for Ironman 70.3 St. George
  • Average finish time will be around 6 hours, 30 minutes
  • Swim: 45 minutes (expected to be 53% of average 2010 to 2013 swim split)
  • Bike: 3:19 (expected to be 48% of average 2010 to 2013 bike split)
  • Run: 2:15  (expected to be 44% of average 2010 to 2013 run split)
  • Transitions: 0:11 (or about 80% of 2010-2012 splits)
Scroll further down the post to see a detailed set of predictions, by age group, by split, and overall. 


Detailed Analysis of Ironman St. George 2010 to 2012


\\


Unfinished Business in Boston: Projecting Non-Finishers' Finish Times


It's about time. Literally. It's about declaring projected finish times for the thousands of Boston Marathon runners who were not allowed to finish after the terrible tragedy suspended the race.

Three weeks have passed since the tragedy, and yet there is no resolution for those thousands who have every right to declare themselves Boston Finishers, given the circumstances of the day. Time for closure. Time to define your projected finish time. The BAA's resolution isn't ready yet, which is reasonable, given the myriad of other issues they face.

Until then, it's time to step up with projected finish times, and we've taken on the assignment (unofficially). We ran the numbers, slicing and dicing the data every which way (see notes on Methodology, below), and after hours and hours of detailed analysis, I'll get to the punchline.

Projecting Your Boston Marathon 2013 Finish Time

What might your finish time have been?  It may be as simple as this:
  • If you were stopped after 35k, your effective finish time may = 35k time multiplied by 1.23
  • If you had crossed the 40k, your effective finish time could =  40k time multiplied by 1.06
Is this 100% accurate? No. But I'd expect our projected results will be within a minute or two in a wide majority of the cases.

But: One exception will be the runners who went out too fast, too early, and had hit the wall, slowing to a crawl. See our Correlation Between First and Second Half Split Times to gauge if you fit in that group.

Will the BAA's resolution be different? It very well could be. We don't know what direction they will go. But one thing is clear: our analysis here is unofficial; BAA's will be the official resolution. 

Methodology

Background: our perspective on this topic comes from several dimensions. We know the course intimately; 13 consecutive Boston finishes. We've been presenting in-depth coverage of the Boston Marathon for years, see www.RaceBoston.com. We've developed and posted dozens of analytics and diagnostics about Boston; see our Stats/Results/Analysis archive for more than 200 posts analyzing top marathon and triathlon events. We're not new to projecting finish times based on incomplete data; see many examples in our Race Statistics/Results Analysis archives. Most recently, we projected finish times of the new Ironman 70.3 St. George within 1% of actual.]


We noted the multipliers above were 'deceptively simple' because it took a great deal of work to confidently calculate the appropriate value. 

Our approach is illustrated in an example of our analysis of all Illinois finishers in the 50-54 age group. This included 53 men, 19 women. We did extensive analysis of this sampling of runners, tabulating their 5k splits from start to finish, comparing an contrasting splits from sub-3 hour finishers to 4+ hour runners, from Boston re-qualifiers to those who, well, didn't come close to requalifying. 

See data below, from drill-down detail for each finisher, up to average splits as a percent of total, which we used to calculate the 35k and 40k multipliers.

Male Finishers Aged 50-54 from Illinois


Female Finishers Aged 50-54 from Illinois


For more on our extensive Boston Marathon analysis, see our Complete Boston Marathon Coverage. For even more, see our archive of 200+ Race Stats/Results Analysis posts 
.


Top 100 Most Popular Triathlon and Marathon Analytics and Articles on RunTri.com 12/2013


Top 100 Most Read Posts


 Top 25 Best Half Marathons
 Hardest Ironman Course? Easiest? RunTri's 30 Toughest Ironman Races
 How Much Time Does it Take to Finish an Ironman Triathlon? Average Ironman Finish Times
 Easiest Half Ironman 70.3? Hardest? RunTri's Ranking of Best Half Ironman Races
 Qualify for Ironman Kona Hawaii: Races, Qualifying Times, Slots, Races, Analysis, Motivation, and Advice
 How Much Time Does it Take to Finish a Half Ironman 70.3? Average Half Ironman Finish Times
 Ironman 2014 Triathlon Schedule, Dates, Entry, Results, Kona
 Ironman Kona Qualifying Times: Comparing 30 Ironman Races
 The World's Top 25 Best Triathlons: Finding Your Perfect Race
 Ironman Kona Qualifying Times, Slots and Changes: 2012 - 2013 Season
 Triathlon
 Stats/Results/Analysis
 How Much Time Does It Take to Finish A Marathon? Average Marathon Finish Times
 Home/Site Map
 Qualify for Boston Marathon 2014: Qualifying Times, Best Races to Qualify, Analysis and Advice
 Lance Armstrong Ironman Triathlon Results Analysis
 Toughest/Easiest Marathon? RunTri's Top 25 Marathon Rankings
 Ironman Kona Hawaii 2013: Results Analysis, Advice, Qualifiers, Photos, More
 Average Ironman Triathlon Finish Times, Splits by Race and Age Group
 Training Plans for Marathon and Ironman Triathlon
 ING New York City Marathon 2013: By The Numbers, Results Analysis,Advice, Photos
 Boston Marathon: Average Finish Times by Age
 Ironman Kona
 Ironman Cozumel Kona Qualifying Times and Slots by Age Group
 Top 50 Best Races to Qualify for Boston
 Toughest/Easiest Ironman Bike Course: Comparing 25 Ironman Races
 Triathlon FAQ: Frequently Asked Questions
 Ironman Lake Tahoe 2013: Results Analysis
 What will Your Ironman Finish Time Be, Based on Half Ironman 70.3 Results?
 Dahon Speed Pro TT Folding Bike: The Rave Review
 Marathon and Triathlon Training Time: Overview
Olympic/International Distance Triathlon: Chicago Triathlon vs USATNational Champs Competitor Times
 Marathon
 Boston Marathon 2014: Qualifying, Tips, Results Analysis, Statistics, Photos and More
 How Much Time Does it Take to Finish an International Distance Triathlon? Average Finish Times
 Boston Marathon
 New York City Marathon: Average Finish Times by Age Group
 Ironman Races and Kona Qualifying Slots by Race -- 2012 Season
 Hardest/Easiest Ironman by Age Group: 25 Races Compared
 New York City Marathon 2013: Complete Results Analysis
 Ironman USA Lake Placid: Everything You Need to Know
 Top 50 Best Marathons
 Ironman Cozumel 2012 Results Analysis
 Marathon and Triathlon Statistics, Analysis and Advice
 Ironman Texas 2013 Results Analysis
 Boston Marathon 2014 Unofficial Final Qualifying Time Prediction: BQ Time Minus 1 Minute, 34 Seconds
 Ironman Kona 2013 Results Analysis
 Runner or Triathlete? Why Not Both?
 How Fast Did Oprah Run a Marathon?
 Ironman Kona Hawaii 2012 Lottery Winners Analysis
 Ironman Arizona 2013 Results Analysis
 Planning Your Training and Racing Year
 Ironman Cut-off Times: Can it Really Take 17 Hours to Finish an Ironman?
 Ironman Wisconsin 2013 Results Analysis and Photos
 Ironman Arizona: Advice, Analysis, FAQ
 Average Marathon Finish Times 2000 to 2013: Boston, New York City, Chicago, MCM
 Ironman Whistler Canada 2013 Results Analysis
 Ironman Wisconsin: Racing Advice, Analysis, Photos and more
 Tips for Ironman Competitors: What to Do Before the Race Starts
 New York City Marathon 2013 Around the World: Fastest 110 Countries, 5,000 Cities
 Ironman Lake Tahoe DNF (Did Not Finish) Rates Analysis: Comparison with Other Ironman Race DNF Rates
 Chicago Marathon 2013: Results Analysis, Advice, Pace Charts, Photos and More
 Ironman 2013 Schedule: Ironman and Ironman 70.3 2013 Events and Kona Slots
 Ironman 70.3 Mallorca 2013 Results Analysis
 Ironman Lake Placid 2013 Results Analysis
 Notes for Marathon Rookies: What to Expect in Your First Marathon
 Half Ironman 70.3 Triathlon: Hardest Courses, Easiest Courses, and Details
 Ironman Kona 2013 Top Women Finishers Results Analysis
 A Competitive Edge: Dahon Speed TT Pro Folding Bike Review
 Ironman Lake Placid Bike Course: What to Expect
 Half Ironman Kona Qualifying Times, Slots, and Races
 Ironman Western Australia Results Analysis and Kona Qualifying Times
 Ironman Canada 2012: Stats/Results/Analysis and Advice
 Ironman 70.3 St Polten Results Analysis
 Number of Annual Ironman Triathlon Finishers
 Ironman 70.3 St. George 2013 Results Analysis
 Never Settle: Racing to Qualify for Kona, to PR or to Finish -- Motivation and Advice
 Ironman Kona Hawaii By The Numbers: Statistics/Analysis
 Ironman Kona: Average Swim, Bike, Run and Finish Times by Age Division
 Ironman Arizona Kona Qualifying Times and Slots by Age Group 2009 to 2011
 North American Ironman DNF Rates: Finishers and DNF by Race
 Ironman Louisville 2013 Results Analysis
 Marathon and Triathlon Training Time: Averages and Details
 Ironman Worldwide Allocation of Kona Qualification Slots by Age Group
 Chicago Triathlon: Advice, Results Analysis and Photos
 Toughest/Easiest Ironman Swim Course: Comparing 25 Ironman Races
 Peapod Mobile Results: 50% Growth, $150 Million Revenue
 Ironman Kona 2012 Results Analysis
 Ironman 70.3 World Championship Las Vegas 2013 Results Analysis
 Ironman Cozumel 2011 Results Analysis
 USA Triathlon 2013 Age Group National Championships Results Analysis and Photos
 Boston Marathon 2013 Average Finish Times by Age Group
 Train for a Marathon: to Finish, to Qualify for Boston or set a PR
 Lance Armstrong Wins Ironman Hawaii 70.3 in 3:50:55
 Ironman Arizona: 3 Lap Bike Times and Speeds by Age Group
 Ironman Races in 2010 and Kona Slots Per Race
 Kona Qualifying Times and Slots by Ironman Race: Male 45-49 Age Group

Ironman Lake Tahoe DNF (Did Not Finish) Rates Analysis: Comparison with Other Ironman Race DNF Rates

As Featured by Triathlete Magazine Online Edition
By Raymond Britt

The inaugural Ironman Lake Tahoe 2013 crushed triathletes beyond their wildest expectations, with a record-breaking high average finish time of 14 hours and 6 minutes, easily making it the toughest of the RunTri's Ranking of the Top 30 Toughest Ironman Races.

The venue featured breathtaking scenery, but at the end of the day, the views were not much consolation to the 20% who did not finish the race. Fast Facts:
  • Registered Entrants: 2700+
  • Did Not Start: 565 (21%)
  • Finishers: 1,719
  • DNF of Race Starters: 20+%; DNF on Bike: 267 (12%); DNF on Run: 182 (8%)
The stunning results at Ironman Lake Tahoe seemed to have the triathlon community buzzing (thousands of visitors from 800 cities visited our site's analysis, see map above, and interactive map at end of article): Did you hear what happened at Lake Tahoe? Did you hear about the weather? Did you hear about the DNFs?

Ultimately the biggest question seemed to be: How Ironman Lake Tahoe DNF Rates Compare With DNFs at Other Ironman Events?

The answers may surprise you.
  1. Yes, Ironman Lake Tahoe Was a Punishing Race, and Some Age Groups Suffered More than Others
  2. Ironman Lake Tahoe's DNF Rate falls far short of the 29% recorded at Ironman St. George in 2012, BUT . . .
  3. There's No Guarantee that Ironman Lake Tahoe 2014 Will see 20% DNF, Too; Conditions and DNFs Vary by Year. 
1. Yes, Ironman Lake Tahoe Was a Punishing Race, and Some Age Groups Suffered More than Others

Let's start with our analysis of Ironman Lake Tahoe's DNFs: overall, by age group, and within age groups, DNF rates on the bike or run.


2. Ironman Lake Tahoe's DNF Rate falls far short of the 29% recorded at Ironman St. George in 2012, BUT . . . 

But when Ironman St. George is eliminated from the comparison, Lake Tahoe's DNF rate is highest.  Among other high DNF events, Louisville and Texas don't come close to LT's 20%.


3. There's No Guarantee that Ironman Lake Tahoe 2014 Will see 20% DNF, Too; Conditions and DNFs Vary by Year. 

Our Multi-Year Analysis of DNFs Overall (at Ironman Wisconsin) and by Age Groups (at Ironman Lake Placid) clearly illustrate that DNF rates can vary significantly from year to year.


Which leaves a couple of thousand athletes wondering: should I sign up for Ironman Lake Tahoe next year? If you like the area, the course, and are well-prepared, I'd suggest you sign up for this great race. 

Worried that next year may see 20% DNF again? Sure, it might happen. But I'd not be surprised to see a different DNF rate, more likely to be lower than higher, based on our Ironman Wisconsin and Iron Lake Placid analysis.

Still on the fence? Final thought -- whether DNF rate is 10%, 15% or 20% -- if it were easy, they wouldn't call it an Ironman. Don't be scared by DNF rates, I'd tell you. Prepare vigorously with expectations to be among the 80% of Finishers. 

Go Ahead. Sign up for 2014. Crush the course next time.

RB


Ironman Texas 2013 Results Analysis

See 2014 Results: Ironman Texas 2014 Results Analysis
------------------------------

Triathletes who have finished Ironman Texas in the past will tell you it's one of the tougher races on the Ironman calendar, and the 2013 event more than proved the point. Nearly 2900 athletes registered to compete, and after 13% DNS, and a remarkable 17%, or 408, DNF, the remaining 2,046 finishers took an average 13 hours and 40 minutes to complete the race. The result was 22 minutes longer than the 13:18 average finish time in 2012 and more than an hour slower than the average time to finish an Ironman:12:35. The main differences between Ironman Texas 2012 and 2013 were an additional 11 minutes on the bike, and a marathon took an additional 18 minutes -- 5 hours and 35 minutes.

Typically we see the bike split consume 50% of an Ironman finish time, with 35% spent on the run. Not this year: 46% on the bike, and a staggering 41% on the run.


These DNF rates are not too dissimilar than those at Ironman St. George 2012: 19%


Athletes whose bike/run time landed in the upper left hand corner -- they went after a faster bike split,  left too much energy on the bike course, and suffered mightily on the run. The share of athletes in that upper left hand corner is among the highest we've observed. At the same time, note the lower right hand corner; that space is reserved for those who held back on the bike, with extra energy to run a better marathon.

For more, see:


Three Continents, Three Triathlons: Comparing Ironman 70.3 Events in Busselton, Mallorca and St. George

We compared results analyses of three recent triathlons, on three continents: Ironman 70.3 Busselton, Ironman 70.3 Mallorca, and Ironman 70.3 St. George to see which was fastest, overall or by split, which had the most finishers, DNS and/or DNFs, and how average finish times compared by division. Here are the results.