By Raymond Britt
We've taken the 26,000+ Boston Marathon 2017 finishers and geomapped them by the 6,943 cities they came from, all over the world, and sorted the average finish time by age group by city. Each green dot on the maps represents a city; click one you're interested in, and the results will appear in a pop-up box. For a different view, see out other post, a database with information for all cities and age groups, sorted alphabetically.
For more see www.RaceBoston.com
Boston Marathon 2018 Entrants by Age, Gender and Age Group
By Raymond Britt
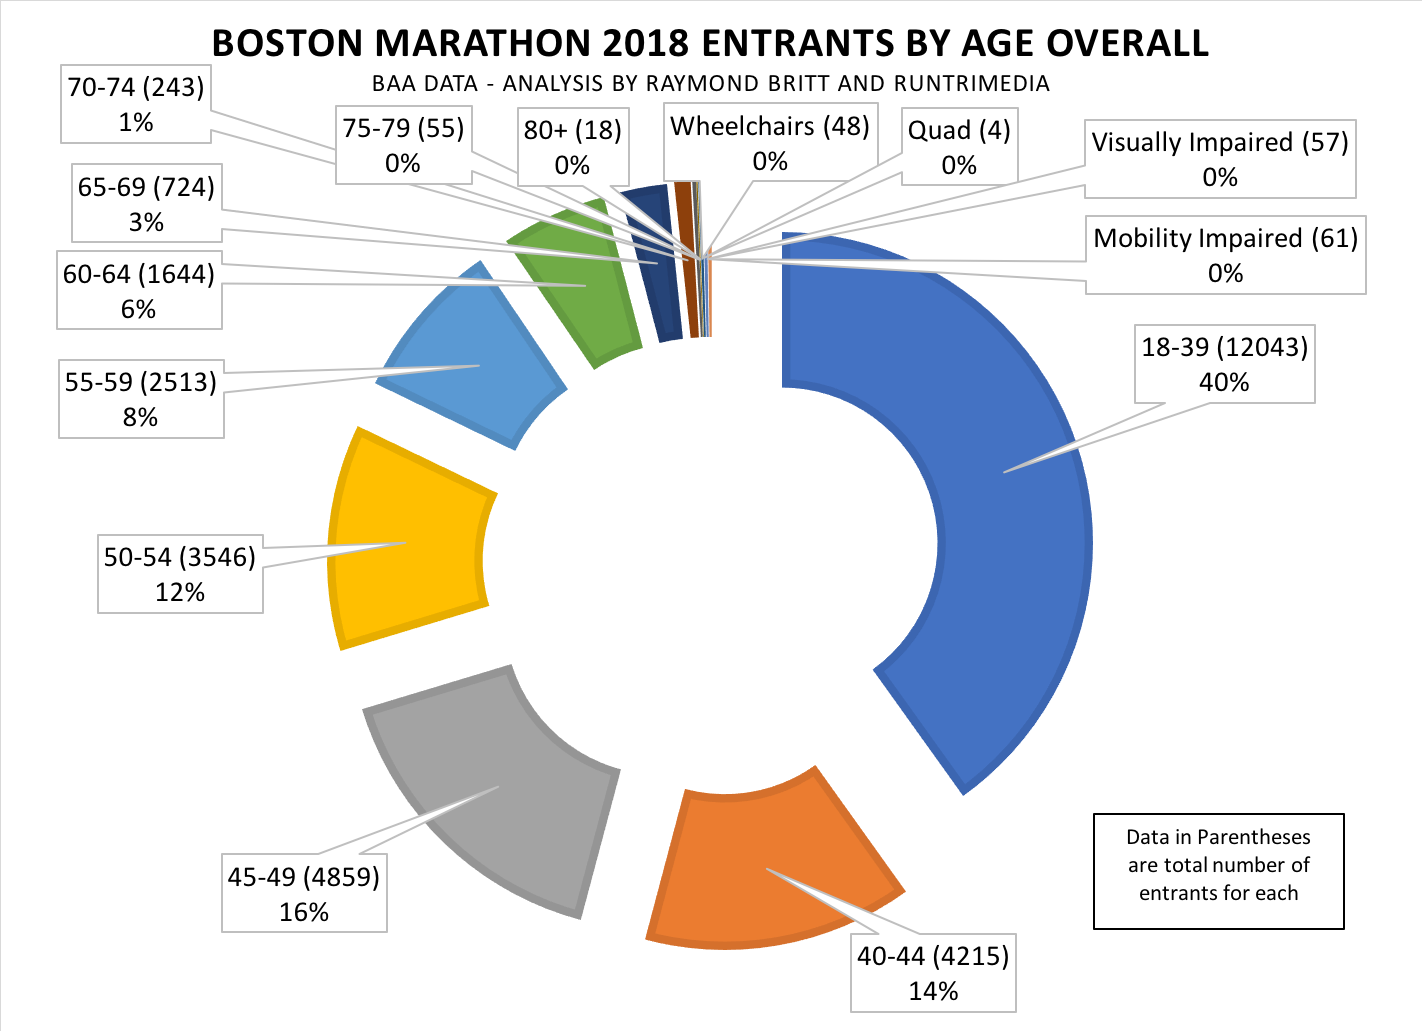
Including all starters -- runners, wheelchairs, handcycles, visually impaired and mobility impaired -- the total Boston Marathon entrants exceeds 30,000. In this analysis, we break the total field into age groups in the first chart, and age groups by gender in the second chart.
Looking at entrants by age group -- men and women combined -- can summarize the largest groups as ages 18-39 = 40%, 40-44 and 45-49 = 30% and 50-54 and 55-59 = 20%. The remainder of the entrants = 10%.

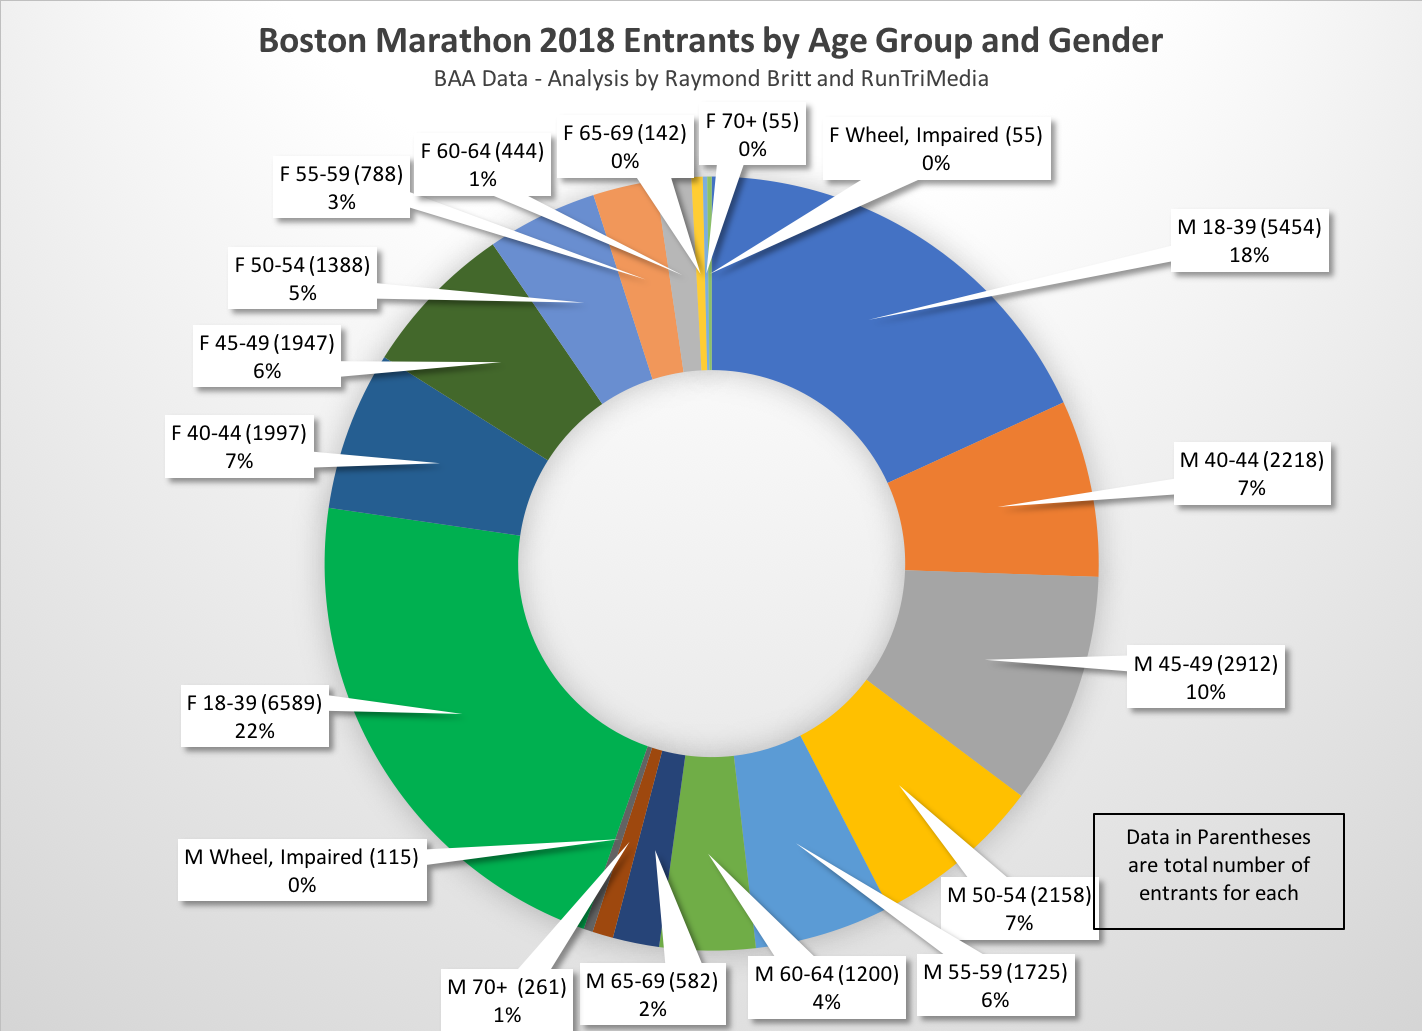
Quite a different story when you slice the entrants by gender and age group. The largest percent of entrants = women 18-39 = 22%. Men 18-39 are next with 18%. At 10%, men 45-49 are the only other group of entrants with percentage in double digits. After that, many other age groups represent fairly similar proportions, in the 5% to 7% range.

For more, see www.RaceBoston.com
Including all starters -- runners, wheelchairs, handcycles, visually impaired and mobility impaired -- the total Boston Marathon entrants exceeds 30,000. In this analysis, we break the total field into age groups in the first chart, and age groups by gender in the second chart.
Looking at entrants by age group -- men and women combined -- can summarize the largest groups as ages 18-39 = 40%, 40-44 and 45-49 = 30% and 50-54 and 55-59 = 20%. The remainder of the entrants = 10%.
Quite a different story when you slice the entrants by gender and age group. The largest percent of entrants = women 18-39 = 22%. Men 18-39 are next with 18%. At 10%, men 45-49 are the only other group of entrants with percentage in double digits. After that, many other age groups represent fairly similar proportions, in the 5% to 7% range.
For more, see www.RaceBoston.com
Boston Marathon 2018: Top 50 Cities with Most Entrants
By Raymond Britt
More than 7,500 cities are represented by runners in the 2018 Boston Marathon, but 50 cities account for about 4,600 runners, or 15% of all entrants. Boston, New York City, Chicago, Ontario and Cambridge are the top 5 cities with the most entrants. London, Beijing, Hong Kong and Tokyo rank generally in the middle of the Top 50.

For more, see www.RaceBoston.com
Subscribe to:
Posts (Atom)
