By Raymond Britt
We're proud to have run and finished the New York City Marathon, one of the best marathons in the world. We've done a great deal of analysis to help understand the race's dynamics, how it compares to other major marathons, and what to expect on race day.
New York City Marathon By The Numbers
Here's what you need to know to have your best New York City Marathon experience. For everything else, www.ingnycmarathon.com.


We're proud to have run and finished the New York City Marathon, one of the best marathons in the world. We've done a great deal of analysis to help understand the race's dynamics, how it compares to other major marathons, and what to expect on race day.
New York City Marathon By The Numbers
- New York City Marathon Results Analysis
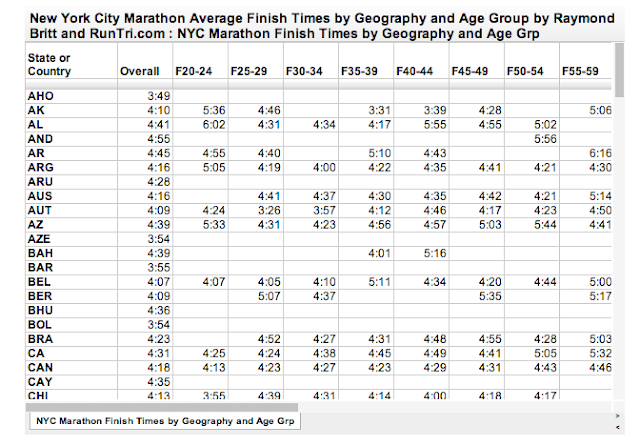
- Geographic Rankings: Fastest Countries and Cities by Age Group
- Average Finish Times 2000 to 2011
- Average Finish Times by Age Group
- Number of Finishers by Age Group
- Predicting NYC Marathon Time Based on Your Half Marathon Results
- Geographic Results: Finish Times by Age Group by State or Country
- Impact of Weather Conditions on Finish Times 2000 to 2016
NYC Marathon vs Other Top Marathons
- Average Time to Finish a Marathon
- NYCM vs Top 25 Toughest Marathons
- NYCM vs RunTri's Top 50 Best Marathons
- Wall Street Journal & RunTri Analysis: Are Europeans Faster Than Americans at NYCM?
NYC Marathon vs Boston, Chicago and Marine Corp by Age and Age Group
- New York City and State Finisher Performance at Chicago Marathon 2013
- Average Finish Times by Age Group: NYC vs Chicago and Marine Corps Marathons
- Average Finish Times Age 18 to 71: NYC vs Chicago, Marine Corps and Boston Marathons
- New York City Marathon Among Most Popular Marathons Search Trends
Here's what you need to know to have your best New York City Marathon experience. For everything else, www.ingnycmarathon.com.

Other RunTri.com Marathon Resources


+by+Avg+Finish+Time%0BBy+Raymond+Britt+and+RunTri.png)


